I know there are lots of users want to have an easier way to create a child theme without all the hassles, so here we go. As promised, I’ve made a simple child theme based on the latest version of Reverie, and uploaded it to Github. You can get quick access to the code through this link, download it or fork to your own repo.
After a couple of weeks after the release of Foundation, today I am happy to announce the release of Reverie 5, the WordPress framework based on ZURB’s Foundation. The layout of Reverie hasn’t changed a lot since the first release. We continue to see the flat design trend and even iOS 7 has a colorful look, guess it is time to rethink a bit. So in this version, a new design is presented and how you will like it.
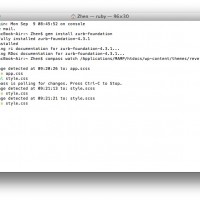
Foundation first introduced Sass version in its third version and Reverie only has the Sass stylesheet packed in its forth edition. In this tutorial, we will go through the process of setting up Compass and Sass for creating your Foundation/Reverie theme, as well as child themes.
ZURB just released the third version of their Foundation Icon Font today. During the redesign of the blog, Foundation Icon Font was not used due to the limitation of fonts in its second version. Instead, I use Fontello to search and assemble the necessary fonts from across the web which is basically what the service provides. There are also other icon fonts on the web if you don’t like Foundation’s. Foundation Icon Fonts version 3 provides a better integration with Foundation framework (and of course Reverie) so you don’t need to worry about the size or padding problems when you use services like Fontello or IcoMoon.
After revamping the blog last week, I thought I could do something more. When ThemeFortress was launched, we had a small forum for the support of Reverie framework, and later the development was moved entirely to Github. While Github is good for tracking all kinds of issues, it is generally difficult to post questions other than bugs or feature requests on the platform. To deal with the needs of users who want to customize the framework, which is more or less the main purpose of why you are actually using it, we created a Google Group. Now I would like to bring back the forum to support Reverie framework and other future new themes right here on ThemeFortress. We have Github deal with all the development needs, and thus the new forum will be used for customization and general support purpose.
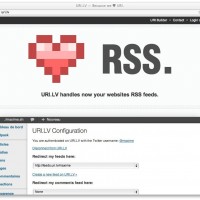
How many of you are sad about the demise of Google Reader, and how many even more afraid of losing something that is more important to your daily feeds, your subscribers. Even before the close of Reader, we’ve heard that Google is also dropping Feedburner, like the rest of the services that they acquired, poor Sparrow. Alternative way is to revert back to your WordPress default feed which somehow losing the ability to track stats. Today I’d like to talk a bit about a new feed service URI.LV, which may be considered as an alternative to Feedburner.
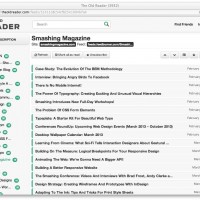
The best thing of the week is that I received my second Mac, the Macbook Air 13 (2012) after using a Macbook Pro 13 since around three and a half years ago. While the bad thing, which is really bad, is the Google is shutting down Google Reader, the best service that Google has ever created, at least to me. This is really bad. It basically kills my daily reading in a single strike, leaving me to search for an alternative which literally doesn’t exist.
The latest update of Reverie brings several new features and hope you like it. So far in previous versions of Reverie, I basically ignored child theme support since I personally prefer doing all the work by editing the original files. So in this post, I will go through some necessary steps to enable the child theme support for Reverie.
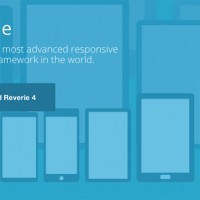
Foundation 4 goes mobile first, which means we need to reverse the way and process we construct a design, by starting from a small screen and then adding parts for the large screen. Work for two days and now I would like to announce the release of the new version of Reverie Framework, which also has the same version number 4. Before jump right to the download section or the Github page, you will, or most likely, are required take a look at the below changes otherwise you may end up a terrible weekend. So, let do it now, backup your theme.
Not a big fan of Box.com and you might read my complaint for not having a sync tool on Mac. While indeed there is one that is made for enterprise users but Box.com kindly made it available to individual users for free a white ago. If you haven’t got it, you can download it on the official website. The tool works well and sitting on your Mac’s Preference Panel. However, one thing left to complaint is the menu bar icon being a bit not well designed. The color icon looks like a resize of the big icon while the black one not being polished.